Archive for June, 2010

Handling Worksheet_Change for a Named Value

I was recently thinking about an example of handling the Worksheet_Change event. Unlike, say, opening a Workbook or clicking an ‘OK’ button, this is a ‘background’ event, which happens many times during an editing session. So we need to be quite specific about which changes we’re interested in. An obvious test is to check whether the name of the target Range is relevant.

An example that springs to mind is keeping a log of changes to some key value: something like a tax rate, where the act of changing the value is itself of interest. It is also important that transaction records pick up the appropriate rate for their date, not the latest value.

Here is a simple Orders table:

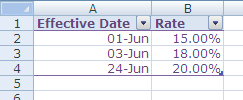
The various Orders pick up their tax rate from a Rate table:

The Rate column in the Orders table has the formula:

=VLOOKUP([Date],RateTable[#Data],2,TRUE)

When the Tax value (top-right of the first screenshot) is edited, a new row is added to the Rate table.

We can do this by handling Worksheet_Change on the Orders Worksheet:

Private Sub Worksheet_Change(ByVal Target As Range)
'If Target is the named Range "Tax",
'then extend the change log
'on Worksheet "Tax Rates",
'with today's date and the new value.

The easiest (only?) way of checking the Range Name is to have a go, and handle the error if it is unnamed:

    On Error GoTo finish
            'If Target does not have a Name,
            'then Target.Name raises an error
            'So just ignore the event.
    Dim rngname As String   'Possible name of Target
    rngname = Target.Name.Name

If Target does have a name, and that name is ‘Tax’, then add a row to the Rate table:

    If rngname = "Tax" Then
        Dim newrow As ListRow

        Set newrow = _
        Worksheets("Tax Rates").ListObjects(1).ListRows.Add

        newrow.Range.Item(1).Value = Date
        newrow.Range.Item(2).Value = Target.Value

    End If
finish:
End Sub

The use of the Date function ensures that the first column of the Rate table is sorted ascending, which is required by the VLOOKUP. If you make more than one change of Rate on a given date (for example, you correct a mistake), the VLOOKUP picks up the latest value. So if today (24/6) I make a further change from 20% to 21% (I blame the fiscal squeeze), then this rate is picked up by today’s orders.

Sub-sequence Iterator 3

In the previous post, we were looking at an iterator object that bound to successive sub-sequences of records in a table, according to a StartCondition and an EndCondition. In that example, the sub-sequences were contiguous, non-overlapping, and so could be summarized to give sub-totals in a very flexible way.

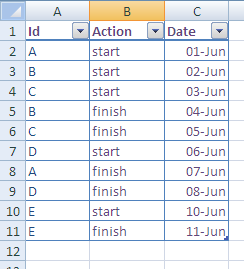
A slightly different example is where the start and end records for each sub-sequence are all intermixed. Here’s a time-ordered sequence of start and finish actions, for some identified entities:

You can see that B and C both start and finish before A finishes.

Suppose that want to find out the duration of each activity. We then need to find matching start and finish records, and calculate the difference between the two dates. In this case, the sub-sequence is the ‘lifetime’ of the entity. Although we are not interested in anything other than the start and finish for an entity, it’s conceivable in other examples that we might be interested in the intermediate values.

In the previous example, the sub-sequences were non-overlapping, so the MoveNext operation started looking for a new StartRow immediately after the old EndRow. Here, the sub-sequences can overlap, so the MoveNext operation starts looking for a new StartRow immediately after the old StartRow . At present, each entity is assumed to have a finish record.

StartCondition simply looks for a ‘start’ record; when it finds one, it records the Id. EndCondition looks for a ‘finish’ record with the current Id.

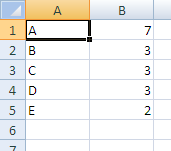
The client code creates an iterator on the Actions table (see above), moves it through the table, calculates the duration for each entity (finish – start + 1), and writes a summary record:

Here’s the client procedure:

Sub Run()
    Dim ssi As SSI2
    Set ssi = New SSI2
    With ssi
        .WsName = "Actions"    'Worksheet
        .TableName = "ActionTable"
        .KeyName1 = "Id"       'Key column
        .KeyName2 = "Action"   'there are 2 key columns
        .ValName = "Date"      'Value column
    End With

    Worksheets("Summary2").Activate  'for the output
    ActiveSheet.Cells.Clear

    Dim row As Long
    row = 1
    ssi.MoveNext     'to first sub-sequence
    Do Until ssi.IsAfter
        Range("A" & row).Value = ssi.Label
        Range("B" & row).Value = Summarized(ssi.values)
        row = row + 1
        ssi.MoveNext
    Loop
End Sub

Private Function Summarized(values As Variant) As Variant
'pre: IsArray(values)
    Dim last As Long
    last = UBound(values)
    Summarized = values(last) - values(1) + 1
End Function

I think this is quite an interesting example, as it’s not obvious to me how you would do it with formulas, even array ones.

At present there are two different classes for the two examples (non-overlapping and overlapping) – hence SSI2, above. Maybe they should both implement a common interface. In practice, though I think you’d know which flavour you needed. Here’s the workbook with both examples, if you want to try it out.

Sub-sequence Iterator 2

Following on from the previous post, I’ve had a go at implementing a Sub-sequence Iterator (SSI) class, which operates on a named Table ( a 2007 table, a.k.a. ListObject). There are two variants, depending on whether the sub-sequences can overlap or not.

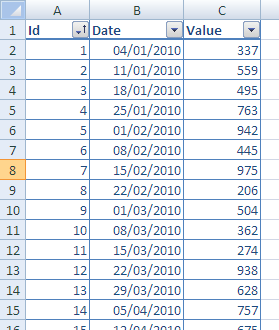
The first case is similar to the earlier data partitioning, where we want to break our table rows into contiguous, non-overlapping sub-sequences, and perform some summarizing operation over the values – for example, subtotalling. Here’s the data table:

The Date column is our ‘key’, by which we work out the sub-sequences. In this case it’s just a weekly incrementing date. The Value column contains the data that we want to summarize. For simplicity, let’s say that we want to summarize by month – although it could be something more interesting.

Our SSI object has a MoveNext operation, called by some client code, which makes it iterate through the sub-sequences. For each sub-sequence, the SSI makes available to the client code:

  • a Label that can be used to identify each sub-sequence
  • an array of Values for the sub-sequence.

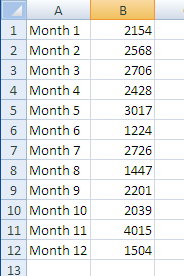
The client code can then pass the Values to a function Summarized, which in this case calculates a (sub)total. The client code then writes the Label and the Summarized value to another worksheet:

Here, the Label is just “Month ” prepended to the month number (January -> 1, etc).

Now, you might be wondering why we don’t just add a Month column to our table, and generate a pivot table, aggregating by month.

Firstly, we might want to partition our dates in many different ways: by month, quarter, Mayan Lunar Year, and so on. It would be cumbersome to have to add a column, with appropriate values, for each of these partitionings. Indeed, our table might be linked to some external data source which has only the raw data.

Secondly, a particular partitioning might depend on the data values themselves (for example, a negative value terminates a sub-sequence), or some dynamic value, such as today’s date.

To customize the SSI class for a particular table, we need to write:

  • Function StartCondition(row As Long) As Boolean
  • Function EndCondition(row As Long) As Boolean
  • Function Label() As String

In this example, StartCondition and EndCondition are both looking for changes in Month. When the SSI finds new rows satisfying these conditions, it sets StartRow and EndRow, which then delimit a new array of Values.

I’ll talk about the second variant – where we can have overlapping subsequences – in the next post.


June 2010
M T W T F S S
 123456
78910111213
14151617181920
21222324252627
282930